
Much has been covered about developer salaries based on coding language, location, job title, and so on. However, little has been done to chart the rise and fall of developer salaries over the years.
Tracing developer salaries over the last 20 years was an interesting endeavor. Researching the topic meant changing the language I used to search for data.
Back in the early 2000s, tech and software were referred to as “Information Technology” (IT) or “Information and Communications Technology” (ICT), developers were still referred to as “IT workers” and little was mentioned about the many specialized roles we have today.
To go back in time, I mainly referred to data published by the U.S. Bureau of Labor Statistics as they offered the most comprehensive year on year data. I looked at data from alternate years, from 2001 to 2019.
Starting in the year 2000
At the turn of the century, CNN Money reported that the average starting salary for an entry-level computer programmer was $40,800.
Fresh graduates were also paid differently based on the degrees they held:
- Computer engineering: $49,505
- Computer science: $48,740
- Information science: $38,900
- Management information systems: $41,800
Due to the shortage of skilled workers going into tech fields, salaries in America for IT graduates became more and more competitive. Salaries in 2000 were already 10% higher than the previous year and, apart from information science majors, were well above the national average starting salary of $39,824.
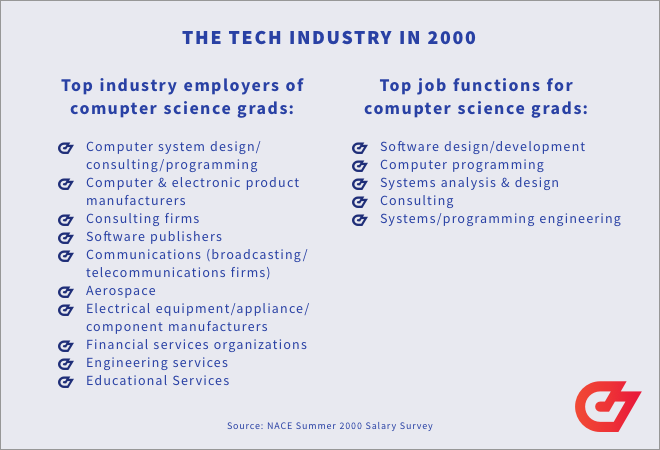
The following table shows the average annual salary for developers, programmers, and other IT-related job functions, across all industries in the year 2000:
| Annual mean ($) | Annual median ($) | |
|---|---|---|
| Computer & Information Scientists, Researchers | 73,430 | 70,590 |
| Programmers | 60,970 | 57,590 |
| Software Engineers - Applications | 70,300 | 67,670 |
| Software Engineers - Systems Software | 70,890 | 69,530 |
| Computer Support Specialists | 39,680 | 36,460 |
| Database Administrators | 55,810 | 51,990 |
Tracing developer salaries in America from 2001 to 2019
From 2001 to 2011
The graph below shows the annual median and mean salary from 2001 to 2011. These are the relevant job functions I examined, based on the data available from the Bureau of Labor Statistics:
- Computer and information scientists
- Programmers
- Software engineers - Applications
- Software engineers - Systems software
- Database administrators
What is immediately noticeable is the huge difference between the median and mean salaries for various job functions across all industries, indicating a large difference in salaries for IT workers across the different sectors.
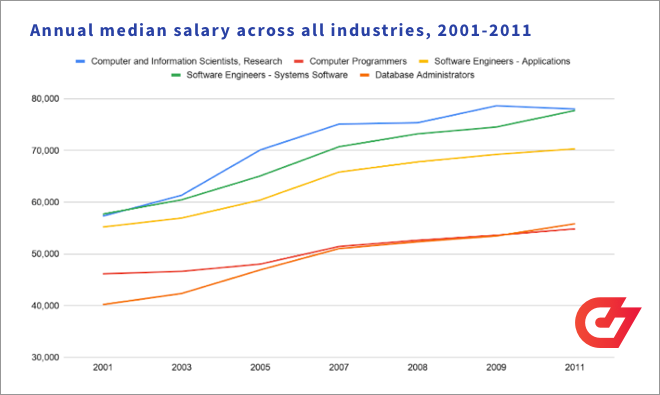
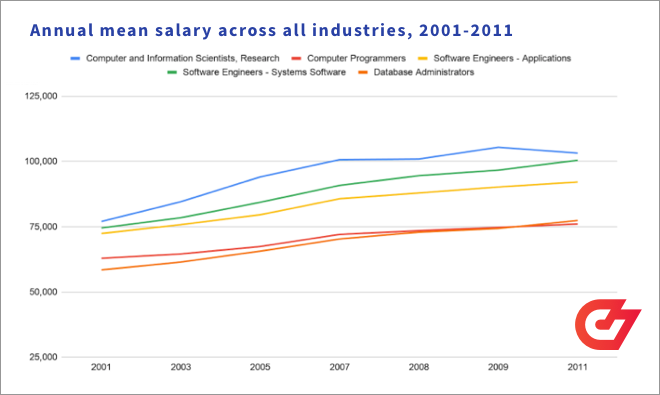
In the first decade alone, Americans experienced two huge economic crises, sending rippling effects throughout the American and global labor market.
2001 was the year the dot-com bubble burst. That year, while wages did not fall despite the dot-com burst, around 400,000 Americans working in IT-related roles lost their jobs going into 2001.
2008 was when the stock market crashed. Similar to the dot-com burst in 2001, wages in 2008 remained relatively unchanged. However, roughly 111,000 Americans working in IT-related fields lost their jobs going into 2009.
2008 was also the year when wages began to increase at a slower rate compared to previous years. While individuals enjoyed an average of $5,000 increase every two years previously, after 2008, wages only increased by $2,000 every two years.
Generally speaking, from 2001 to 2011, individuals working in tech had at least a 21% increase in wages over time. Systems Software Engineers experienced the largest jump in wages, an increase of 35%.
Average salary increase from 2001-2011:
| 2001 ($) | 2011 ($) | Increase ($) | % Change | |
|---|---|---|---|---|
| Computer Software Engineers - Systems Software | 74,490 | 100,420 | 25,930 | +35% |
| Computer and Information Scientists | 76,970 | 103,160 | 26,190 | +34% |
| Database Administrators | 58,420 | 77,350 | 18,930 | +32% |
| Computer Software Engineers - Applications | 72,370 | 92,080 | 19,710 | +27% |
| Computer Programmers | 62,890 | 76,010 | 13,220 | +21% |
From 2013 to 2019
From 2013 onwards, the Bureau of Labor Statistics changed how it categorized tech-related job functions. It added more job functions to the Computing category, mirroring how the profession had evolved since the early 2000s.
In light of this, I analyzed the broad job function groups available, rather than diving into specific job functions, to get a comprehensive overview of salaries.
Below are median and mean wages for the following job function groups:
- Computer and information research scientists
- Computer and information analysts
- Software developers and programmers (2019 data included Software Quality Assurance to this group)
- Database and systems administrators and network architects
- Computer support specialists
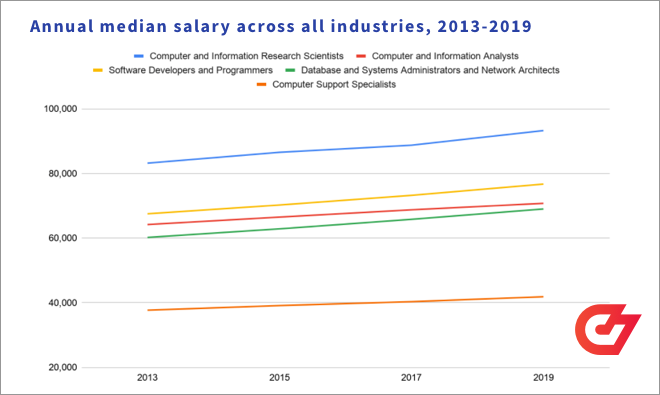
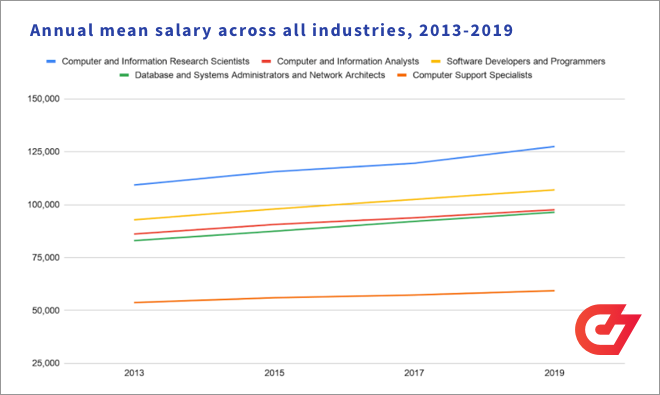
In 2013, the national American wage for graduates was $45,327. Workers in tech continue to earn well above the national average.
Similar to the previous period, computer and information researchers continued to earn the most out of the group. In 2019, the average annual income for computer scientists was $127,460, 19% ahead of software developers, and programmers.
Fewer "programmers", more "developers"
When analyzing salaries, it is also important to look at the employment numbers for job functions to get an indication of the supply and demand for specific skills in the labor market.
Computer programmers
| Year | Total employed | Annual mean ($) |
|---|---|---|
| 2001 | 501,550 | 62,890 |
| 2003 | 431,640 | 64,510 |
| 2005 | 389,090 | 67,400 |
| 2007 | 394,710 | 72,010 |
| 2009 | 367,880 | 74,690 |
| 2011 | 320,100 | 76,010 |
| 2013 | 312,340 | 80,930 |
| 2015 | 289,420 | 84,360 |
| 2017 | 247,690 | 87,530 |
| 2019 | 199,540 | 92,610 |
In 20 years, we can see a 60% drop in the number of people employed for computer programming roles in America. Annual wages, on the other hand, increased by 47% in the same period.
Software developers
In this section, I removed 2019 data as I was unable to separate developer functions, whether they specialized in applications or systems.
Applications Developers:
| Year | Total employed | Annual mean ($) |
|---|---|---|
| 2001 | 361,690 | 72,370 |
| 2003 | 392,140 | 75,750 |
| 2005 | 455,980 | 79,540 |
| 2007 | 495,810 | 85,660 |
| 2009 | 495,500 | 90,170 |
| 2011 | 539,880 | 92,080 |
| 2013 | 643,830 | 96,260 |
| 2015 | 747,730 | 102,160 |
| 2017 | 849,230 | 106,710 |
The number of software developers hired to work on applications has increased by 135% from 2001 to 2017. Annual salaries increased by 47% in that period.
Systems developers:
| Year | Total employed | Annual mean ($) |
|---|---|---|
| 2001 | 261,520 | 74,490 |
| 2003 | 285,760 | 78,400 |
| 2005 | 320,720 | 84,310 |
| 2007 | 349,140 | 90,780 |
| 2009 | 385,200 | 96,620 |
| 2011 | 387,050 | 100,420 |
| 2013 | 373,510 | 104,480 |
| 2015 | 390,750 | 108,760 |
| 2017 | 394,590 | 111,780 |
Systems developers increased by only 50% in the same period, with average wages increasing by 50% as well.
Web developers:
| Year | Total employed | Annual mean ($) |
|---|---|---|
| 2013 | 112,820 | 67,540 |
| 2015 | 127,070 | 70,660 |
| 2017 | 125,890 | 74,110 |
| 2019 | 148,340 | 82,370 |
For web developers, we can see that the total number of employed professionals increased by 31% in just seven years. The average wages for this job function also increased by 21%.
Are developer wages stagnating?
Looking at the data, we can see that developer salaries are not increasing at the rate they used to. As we head into 2013 through to 2019, the annual mean salary for developers and programmers increased from $92,820 to $106,980, a mere 15% increase compared to the whopping 21% increase experienced in the previous decade.
Average salary increase from 2013-2019:
| 2013 ($) | 2019 ($) | Increase ($) | % Change | |
|---|---|---|---|---|
| Computer and Information Research Scientists | 109,260 | 127,460 | 18,200 | +17% |
| Computer and Information Analysts | 86,100 | 97,570 | 11,470 | +13% |
| Software Developers and Programmers | 92,820 | 106,980 | 14,160 | +15% |
| Systems Administrators and Network Architects | 82,960 | 96,380 | 13,420 | +16% |
| Computer Support Specialists | 53,660 | 59,290 | 5,630 | +10% |
One of the reasons for the slower rate of increase is that the data does not show wages based on seniority and experience. Today, there are more entry-level and junior roles available compared to the early 2000s, and there are more people able to fill those roles.
Interestingly, in 2015, Stack Overflow reported that 42% of developers indicated they were self-taught while in 2019, 63% of developers said they majored in computer science, computer engineering, or software engineering, with 86% of respondents reporting to have taught themselves a new language, framework or tool without taking a formal course.
Another survey by Dice reported that while wages have dropped for developers with less than two years experience, salaries pick up after the three-year mark. Much like other jobs, developer salaries increase with more experience they accumulate.
| Years of Technical Experience | 2018 | 2019 | % Change |
|---|---|---|---|
| Less than 1 year | $57,541 | $55,231 | -4.00% |
| 1 - 2 years | $58,755 | $58,718 | -0.10% |
| 3 - 5 years | $69,671 | $74,706 | 7.20% |
| 6 - 10 years | $82,094 | $85,927 | 4.70% |
| 11 - 15 years | $96,421 | $99,138 | 2.80% |
| More than 15 years | $113,503 | $114,915 | 1.20% |
What to expect in the future
In the years to come, industry experts expect low-level coding and programming jobs to become obsolete with the development of new tools that remove the need to code completely. Take for example the role of Web Developers when it comes to building websites. With popular CMS tools like WordPress and Squarespace, almost anyone can build a website for their business, reducing the need for people who know “just a little bit of front end web development”.
As automation takes away the need for “basic” coding jobs, new skills or a combination of skills will be needed in the future for roles that don’t even exist yet. The need for field experts and true problem solvers will never disappear. The key is to adapt and learn as new technologies emerge.
Additional sources:
OECD Technology Outlook Report 2000
OECD Technology Outlook Report 2004
OECD Information Technology Outlook Summary 2010
BLS data in Google Sheets
Additional reading:
Technical Recruitment: A Guide